Data & Analytics
Live dashboards and one trusted view of business data.
One set of numbers everyone trusts
Who it’s for
- Reports are built by hand from exports every week or month.
- Two reports for the same period show different numbers.
- Managers can't see production, sales or operations status without asking someone.
- You want to use your data for forecasting or AI, but it is spread across tools.
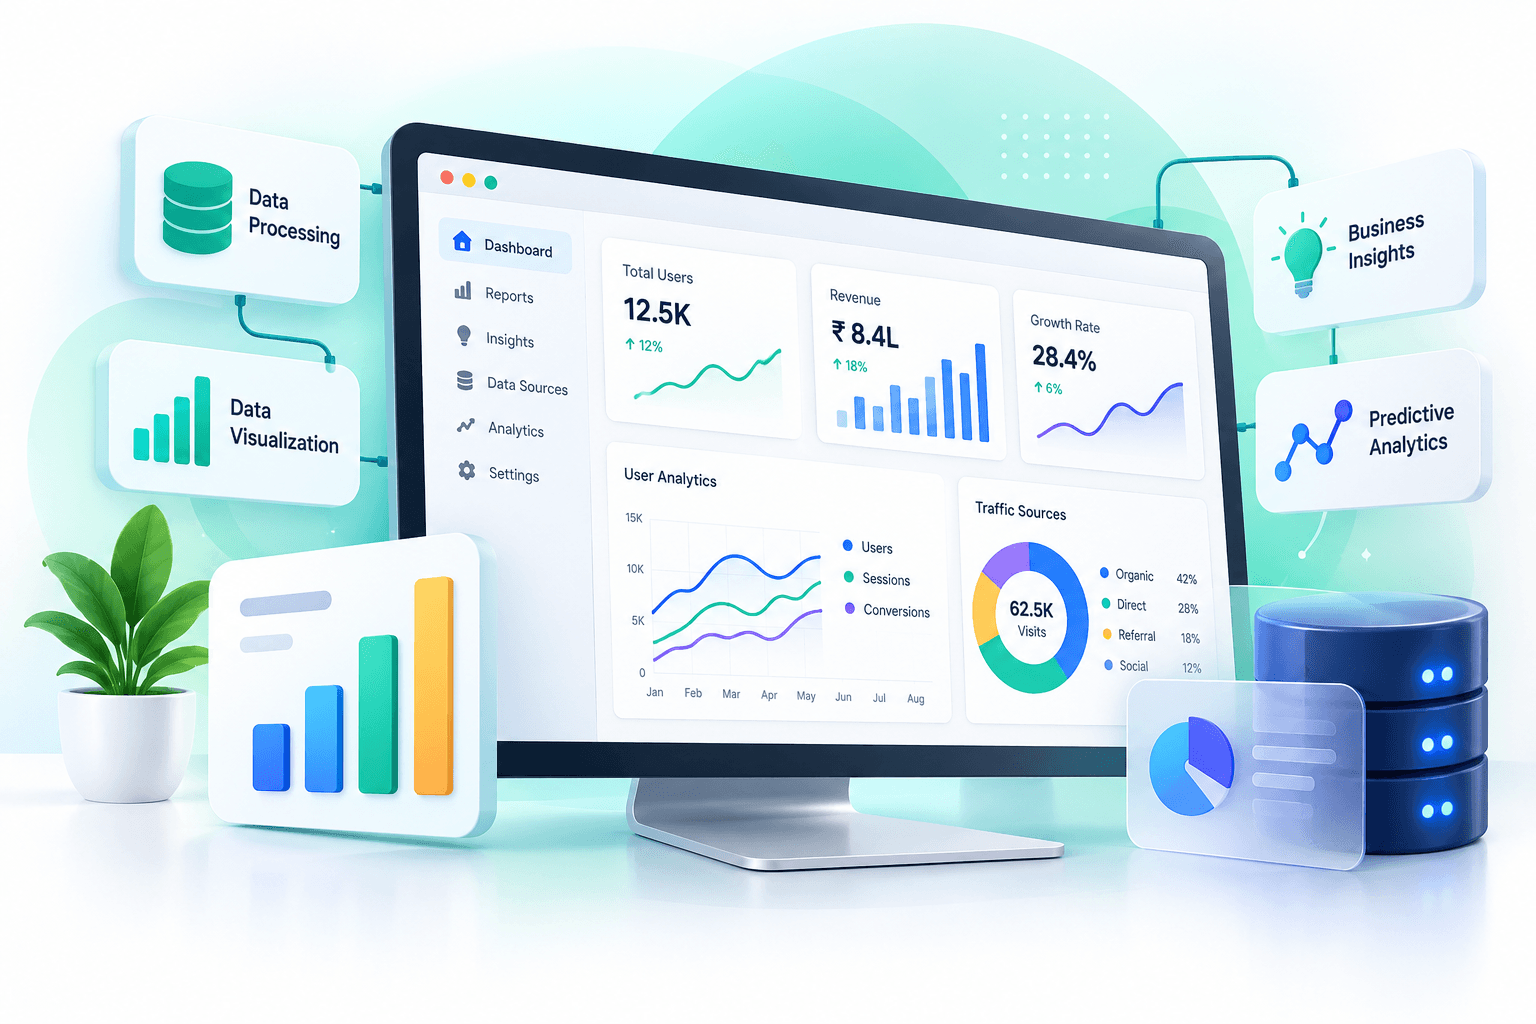
Data and analytics work collects data from a business's tools into one trusted place and turns it into dashboards, reports and alerts that people use to make decisions.
When every tool holds a different version of the truth, meetings turn into arguments about whose numbers are right. We bring the data together so there is one view everyone trusts.
The work starts with definitions: what counts as an order, a completed job, an active customer. Then the data is collected automatically, checked, and shown in a small number of views built for the people who read them.
The result is live dashboards and alerts that show how the business is doing today, not last month.
Problems data & analytics solves
Manual exports and copy-paste reporting
Pipelines that collect data from your tools automatically.
Conflicting numbers
Agreed definitions and one central store that every report reads from.
Problems found too late
Live dashboards and alerts when a number moves or data stops arriving.
Data nobody trusts
Quality checks for duplicates, gaps and inconsistent values before data reaches a report.
What data & analytics work includes
Automatic data collection
Pipelines that pull data from your tools automatically, with no manual exports.
Central data warehouse
A central warehouse that gives every report the same clean source.
Live performance reports
Dashboards that update on their own and answer the questions your team asks every week.
Team metrics & KPI tracking
KPI tracking for teams and the business, defined clearly and measured consistently.
Data error alerts
Alerts when data stops arriving or looks wrong, before it reaches a report.
Industries we apply it in
- Manufacturing & IndustrialStage-wise production progress, work-order status and quality results on one screen.
- D2C & E-commerceSales, stock and campaign data in one place, so spend can be judged against orders.
- Healthcare & ClinicsAppointment volume, load and trends for the people running the practice.
- Local BusinessesA simple view of enquiries, orders and where customers came from.
Related work
All work- Manufacturing · Case studyBudve SmartFlowA system that brings shop-floor production, quality checks and reporting into one place, so the people running the line and the people reading the numbers work from the same record.
- AIEnterprise AI / RAG SystemAn assistant grounded in an organisation's own documents, retrieving what is relevant and answering with it — with the monitoring needed to keep it accurate over time.
How a data project runs
- 01
Agree the questions
We start with the decisions you need to make and the numbers behind them.
- 02
Connect the sources
Automatic collection from your tools into one central, well-modelled store.
- 03
Build the views
Dashboards and reports designed for the people who will read them daily.
- 04
Watch the quality
Monitoring and alerts so the data stays correct as your tools change.
Common questions
Which tools can you connect?
Most tools with an API or a regular export: CRMs, accounting software, e-commerce platforms, ad platforms, databases and spreadsheets.
Do we need a data team to run this?
No. The dashboards are built for non-technical staff, and how the data flows is documented.
How fresh is the data?
It depends on the need and the source. Some views refresh within minutes; others are fine on a daily schedule.
Can you clean up our existing data?
Yes. Fixing duplicates and inconsistencies is a normal part of setting up a trusted source.
Related reading
Explore other services
All services- Software DevelopmentCustom business software, APIs and databases.
- AI & Machine LearningPractical AI: chatbots, forecasting and document intelligence.
- Cloud & InfrastructureSecure cloud hosting, automated releases and monitoring.
- AutomationRemove repetitive work by connecting the tools you already use.
- Marketing & StrategyGrowth strategy, SEO, paid campaigns and brand.
Start a project
Have an idea worth building?
Let’s turn your goals into a working, scalable system.